$499.00 Original price was: $499.00.$73.00Current price is: $73.00.
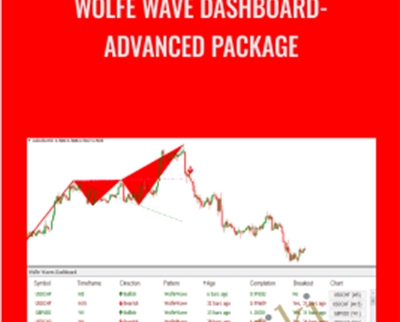
This “Easy Wolfe Wave” indicator automatically detects every single valid Wolfe Wave pattern on every time-frame, every currency pair…
 Purchase this course you will earn 73 Points worth of $7.30
Elevate your skills with the Wolfe Wave Dashboard-Advanced Package course, available for just $499.00 Original price was: $499.00.$73.00Current price is: $73.00. on Utralist.com! Browse our curated selection of over 60,000 downloadable digital courses across diverse Uncategorized. Benefit from expert-led, self-paced instruction and save over 80%. Start learning smarter today!
“Wolfe Waves are a fight towards an equilibrium price and one of the most reliable predictive reversal patterns….” — Bill Wolfe
This “Wolfe Wave Dashboard” Indicator Scans ALL Currency Pairs & ALL Time-Frames For Wolfe Wave Patterns – The Most Reliable Predictive Reversal Pattern IMHO…

Reversal patterns suck.
I mean… Does this sounds familiar?
You identified a reversal pattern. You’ve heard that this is a high-probability pattern. So you placed a trade against the current trend and set your stop loss.
Then, almost as soon as you placed your trade, the market resumed its original trend.
How many times did this happen to you? Honestly I lost count.
Sometimes it feels like the market is playing a joke on me.
That’s why I went on a quest to find the single most reliable reversal pattern out there.
And not only that, I wanted to code an easy-to-use indicator that automatically detects this pattern, so I don’t have to lift a finger.
I’d love to think that I’ve found it.
Here’s why:
There’s a natural pattern that occurs in every market and on every time-frame. It’s called Wolfe Wave. And the interesting part about this pattern is that…
The shape of a Wolfe Wave pattern shows a fight for balance, between supply and demand…
And this is particularly important because…
When the pattern is completed, that means the fight for balance has ended. And you’d know which side has won: Supply or Demand, Bulls or Bears.
In other words, you’d immediately know (with high probability) which direction the market is heading.
So you could be sure whether a trend reversal will happen or the original trend will continue.
No more fear. Now you could trade with confidence.
Peace of mind. That’s probably what most traders (me included) are craving.
Get Wolfe Wave Dashboard-Advanced Package of author Wolfe Wave Dashboard only price 77$
But enough theory. Let’s take a look at Wolfe Wave patterns in action. Here are 2 consecutive Wolve Wave patterns (one bearish and one bullish) that occured on EUR/USD 1-hour timeframe.
Look at this:

And this:

As you can see, Wolfe Wave patterns flat-out works. In this example, the bearish Wolfe Wave pattern is followed by a significant market move to the downside, while the bullish Wolfe Wave pattern marks the beginning of a new uptrend, providing plenty of opportunities to cash in.
Now that you’ve see the power of this amazing reversal pattern, meet our Easy Wolfe Wave indicator:
This “Easy Wolfe Wave” indicator automatically detects every single valid Wolfe Wave pattern on every time-frame, every currency pair…
The indicator does all the hard work, so you don’t have to.
Let’s take a look at how the indicator works:

First, the Easy Wolfe Wave indicator automatically identifies any Wolfe Wave pattern for you, as soon as it’s completed. And it works on every time-frame, every currency pair, every financial instrument for that matter.
When a Wolfe Wave pattern has formed, it means that a trend reversal is likely to happen. So we’d wait for a confirmation that the trend has indeed changed.
And when we’ve got that confirmation, the Easy Wolfe Wave will draw an up/down arrow on your chart, telling you there’s a trade opportunity for you to consider. In addition, the indicator also gives you audio and pop-up alerts.

And here’s where it gets even better:
The “Easy Wolfe Wave” indicator works equally well for BOTH day trading and swing trading…
For example, look at this swing-trading chart on GBP/USD daily time-frame:

In fact, this bearish Wolfe Wave pattern leads to a gigantic downtrend that’s still going on as of the time I’m writing this. What’s amazing is that if I just entered when this pattern was confirmed, I’d have pocketed 3,934 pips so far. How’s about that?
Here’s another swing trading example on AUD/USD 4-hour time-frame:

As you can see, the Easy Wolfe Wave indicator works extremely well on swing trading (on larger time-frame like 4-hour or daily). And if you asked me, I’d say this is my #1 pattern when it comes to identifying trend reversals on larger time-frames.
Now let’s look at a few day trading example. First, EUR/JPY hourly time-frame:

Second, AUD/USD hourly time-frame:

Get Wolfe Wave Dashboard-Advanced Package of author Wolfe Wave Dashboard only price 77$
You’ve seen how powerful this indicator is when it comes to day trading. But that’s not all. This probably is the most useful feature of the Easy Wolfe Wave indicator:
The indicator automatically filters out most false patterns, so you could be sure you get the best trade setups…
Here’s how it accomplishes this amazing feat:
Once a Wolfe Wave pattern has formed, the indicator waits for a breakout in the direction of the Wolfe Wave pattern. When that breakout occurs, the indicator prints an up/down arrow on your chart (and also gives you audio and pop-up alerts), telling you that this Wolfe Wave pattern has been confirmed to be valid.
Otherwise, if that breakout never happens, the pattern is considered invalid.
Let me walk you through a few examples, so you can see how powerful this feature is:


1 month and a half ago, we released the Easy Wolfe Wave indicator.
Out of the blue, it quickly became our top-selling products.
I can sum up what this indicator does in 1 sentence:
“Wolfe Waves are a fight towards an equilibrium price and one of the most reliable predictive reversal patterns”
— Bill Wolfe
You can go here to see it in action…
(But don’t buy it here… at least not until you’ve read this email)
Among the emails we received from happy Easy Wolfe Wave customers, one stands out.
Sandy told me: “Wolfe Wave works. No doubt about it. But I trade 7 currency pairs plus gold and silver.
Takes quite some time to go through each pair to see which pattern has formed”
Gave me an idea.
What if we could apply the “Dashboard” concept and design to Wolfe Wave patterns?
What if we could develop some kind of “Wolve Wave Dashboard” indicator that SCANS all the pairs you want to trade on
all time-frames for the highest-probability Wolfe Wave patterns?
And shows you all the recently formed Wolfe Waves in all markets, on all timeframes on 1 beautiful, easy-to-use dashboard.
I’m happy to say: I’VE DONE IT.
Here’s a teaser: Look at the all-new Wolfe Wave Dashboard in action…

- Wolfe Wave Dashboard indicator displays all detected Wolfe Waves on ONE convenient dashboard.
- You no longer need to manually scan every pair and time-frame. The dashboard does all the hard work for you.
- With just one look at the dashboard, you’ll instantly know which pattern has just formed on every pair and every time-frame (from 1-minute to monthly)…
So…
Let our Wolfe Wave Dashboard do all the heavy lifting for you…
First, it will scan ALL currency pairs and ALL time-frames for the highest-probability Wolfe Wave patterns you could ever find. And all these calculations are done so fast – literally within seconds – you won’t even notice the time.
Then, the indicator will display a beautiful dashboard on your chart where you can see exactly what pattern has recently formed on EVERY pair, EVERY time-frame.
Take a look below to see how cool it really is:

With just one look at the dashboard, you’ll instantly know all the information you need to make a good trading decision. You’ll instantly know which pattern appears on every time-frame (from 1-minute to monthly) and on every currency pair.
Not only that, you’ll also know the exact direction of that pattern – whether it’s bullish or bearish. And you’ll know exactly how long ago that particular pattern showed up.
And you’re in total control. You can specify which currency pairs and which time-frame you want the indicator to scan for Wolfe Wave patterns:

Remember, you can specify as many pairs as you like. You can also use it for indices, stocks, futures, and gold (anything your broker offers in Metatrader). Our Wolfe Wave Dashboard takes care of it all.
Let me show you a short clip where I scroll through 20 currency pairs (and all time-frames from 1-minute to monthly) and see all the patterns on my dashboard:

But maybe the most useful feature of the Wolfe Wave Dashboard indicator is…
Click on the symbol you want, and the indicator will open up that symbol chart with the Wolfe Wave pattern highlighted…
Take a look at this short clip to see what I mean:

That way, you can look at the dashboard first to see the overall picture across multiple time-frames. Then once you identify a pattern that you want to trade, just click on the symbol to open up the relevant chart, so you can analyze the pattern further.
And by the way, did you know that…
You can sort the dashboard in any way you like — based on Symbol, Timeframe, Direction, or Age…
Let me show you exactly how it works:

Pretty cool, isn’t it?
By the way, did you know that…
The Wolfe Wave Dashboard indicator also gives you pop-up, visual, and audio alerts as soon as a pattern has appeared
So you will NEVER miss out on any important trade opportunity.
Now.. maybe the most useful part about Wolfe Wave patterns is that…
These patterns are UNIVERSAL. They work on all time-frames and all currency pairs (any instrument for that matter)…
For example, let’s analyze a few Wolfe Wave patterns that have just formed on the pair AUD/USD on different time-frames:

In this case, you see 3 Wolfe Wave patterns that appeared on 3 different timeframes: 4-hour, 1-hour, and daily time-frames.
All 3 are detected by the Wolfe Wave Dashboard indicator. And both patterns are followed by a big market move in the direction that the patterns correctly predicted.
Listen up, at the top of this page, I demonstrate how our Easy Wolfe Wave – the predecessor of this Wolfe Wave Dashboard – filters out most false patterns. (Scroll up and read it if you skipped that part).
Well… it gets even better:
The Wolfe Wave Dashboard “Advanced Filtering” Feature Takes It To The Next Level…
Here’s how this feature works:
Once a Wolfe Wave pattern has formed, the indicator waits for a breakout in the direction of the Wolfe Wave pattern. When that breakout occurs, the indicator prints an up/down arrow on your chart (and also gives you audio and pop-up alerts), telling you that this Wolfe Wave pattern has been confirmed to be valid.
Not only that, Wolfe Wave Dashboard also tells you exactly how long ago the breakout occurs. So you can plan your trade accordingly.
Cool, isn’t it?
On the other hand, if that breakout never happens, the pattern is considered invalid.
Let me walk you through a few examples, so you can see how powerful this feature is:


But Hang On… We’re Not Done…
Further down this page, you’ll notice there are TWO purchase options you can choose. You can get Wolfe Wave Dashboard indicator alone for an insanely generous price I’m giving the first 200.
Or… you can invest a little more and get the Dashboard Pro package.
So What’s Inside The “Dashboard Pro” Package?
First off, you get the Wolfe Wave Dashboard indicator. And on top of that, you’ll also get access to the ENTIRE collection of ALL of our flagship DASHBOARD indicators. Including Divergence Dashboard, Harmonic Dashboard, Wolfe Wave Dashboard, Day Trading Dashboard, Reversal Dashboard, Candlestick Dashboard, Chart Pattern Dashboard, and more.
Get Wolfe Wave Dashboard-Advanced Package of author Wolfe Wave Dashboard only price 77$
Tag: Wolfe Wave Dashboard-Advanced Package Review. Wolfe Wave Dashboard-Advanced Package download.Wolfe Wave Dashboard-Advanced Package discount.
Cultivate continuous growth with the Wolfe Wave Dashboard-Advanced Package course at Utralist.com! Unlock lifetime access to premium digital content, meticulously designed for both career advancement and personal enrichment.
- Lifetime Access: Enjoy limitless access to your purchased courses.
- Exceptional Value: Benefit from savings up to 80% on high-quality courses.
- Secure Transactions: Your payments are always safe and protected.
- Practical Application: Gain real-world skills applicable to your goals.
- Instant Accessibility: Begin your learning journey immediately after buying.
- Device Compatible: Access your courses seamlessly on any device.
Transform your potential with Utralist.com!
Related products
= 85 Points
Uncategorized
= 95 Points
= 125 Points
= 85 Points
= 65 Points
= 84 Points
= 84 Points
Uncategorized
Disordered Eating Behaviors: Identify and Treat the Underlying Trauma – Lori Kucharski
= 85 Points


